


Learning to become a data analyst from scratch doesn’t have to start with complex coding. For Bloggerpi readers working in SEO, content marketing, or business, a more sensible first step is to master spreadsheets, basic statistics, SQL, visualization, and how to answer business questions with data. Python and BI tools can be learned after this foundation is established.
This article expands on the Bloggerpi author’s personal account of becoming interested in data analytics after working as a Content Strategist. The initial case studies on Ahrefs, Google Trends, Python, and Jupyter are retained for inspiration, but the roadmap below has been updated to reflect Microsoft’s Power BI Data Analyst skillset for 2026.
What does a data analyst do?
Data analysts collect and clean authorized data, analyze patterns, create visualizations, and help stakeholders make decisions. An analyst doesn’t just create attractive graphs; they must be able to define the right metrics, separate correlation from causality, and explain the risks of incomplete data. This is evident in the practice of digital marketing analytics and data-driven marketing in digital marketing teams.
Roadmap for learning data analysis for beginners
| Stages | Materials | Example output |
|---|---|---|
| 1. Spreadsheet | Pivot, lookup, filter, cleaning | Weekly sales report |
| 2. Basic statistics | Mean, median, distribution, sampling | Performance change analysis |
| 3. SQL | SELECT, JOIN, GROUP BY, CTE | Querying anonymous customer datasets |
| 4. BI & visualization | Power BI/Looker Studio, data model | Dashboard with KPI definition |
| 5. Python optional | pandas, notebook, automation | Documented repeatable analysis |
| 6. Communication | Insights, recommendations, data limitations | Business decision memo |
1. Understand spreadsheets before coding
Learn how to differentiate between numeric, categorical, and date data; use pivot tables, lookups, data validation, and conditional formulas. Create practice datasets such as advertising costs and product revenue. If sales figures don’t match total transactions, don’t immediately create a graph; ensure the data definitions and sources are correct.
In the marketing dashboard, UTM tracking can help group campaigns using UTM parameters, but incorrect tags can lead to inaccurate attribution.
2. Learn statistics that actually work
Understand averages, medians, percentages, distributions, variability, and sample-population differences. Data analysts need to know that an increase in traffic after a change doesn’t prove the change was the cause. Learn performance measurement and use the concept of uncertainty before claiming a campaign is successful.
3. Master SQL to get the right data
SQL is essential for reading transaction, product, and activity tables. Start with SELECT, WHERE, GROUP BY, JOIN, then CTE and window functions as needed. For practice MySQL database basics, use a dummy database; do not practice destructive queries on production. Understand data query help write questions that produce reliable results.
Example of a simple transaction report query
SELECT DATE(tanggal_pesanan) AS tanggal,
       COUNT(*) AS total_pesanan,
       SUM(total_belanja) AS omzet
FROM pesanan_demo
WHERE status = 'selesai'
GROUP BY DATE(tanggal_pesanan)
ORDER BY tanggal;
The table and column names are for illustration purposes only, not a universal schema. In an enterprise, you need to understand the definition of completed status, whether refunds are deducted, taxes, and duplicate transaction values before using query results.
4. Master Power BI, Looker Studio and data storytelling
Microsoft divides the Power BI Data Analyst PL-300 2026 edition competencies into four areas: data preparation, modeling, visualization/analysis, and security management. Power Query and DAX are relevant skills for these workflows. Meanwhile, Looker Studio can be useful for Search Console and GA4 dashboards.
Use data visualization so that the graph explains the pattern honestly. For SEO projects, SEO reporting helps build dashboards that display clicks, impressions, engagement, conversions and the right data sources.
5. Is Python mandatory for data analysts?
Not for all entry-level roles, but Python is useful when data is larger or work is repetitive. The original author used Python/Jupyter for data exploration. You can use Ubuntu WSL and Jupyter to build a local Linux environment and install packages in a virtual environment to isolate dependencies.
Study data crawling requires knowledge of source rules and data access permissions. Do not automatically harvest competitor data without checking the terms of service.
6. First case study: Ahrefs SEO data
The initial article contains an example of exploratory data analysis based on Ahrefs data processed with Python and Jupyter. For replication, you can read the context in Ahrefs and do competitor analysis to determine comparison sites. Keep in mind that organic traffic figures in many SEO tools are vendor estimates, not actual figures from Google Analytics.
Historical notebook: Ahrefs travel data exploration. If the archive page changes, use the example context described in this article.
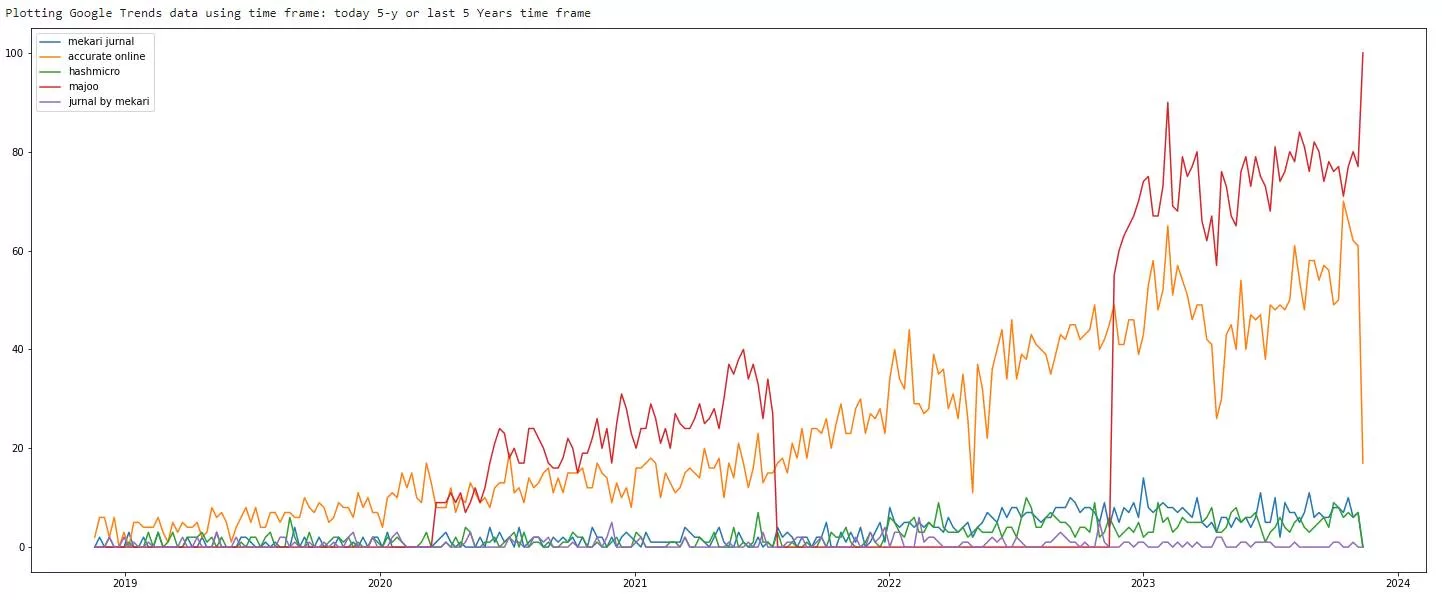
7. Second case study: Google Trends and seasonality
Google Trends shows the relative popularity of search terms, not the absolute volume of searches. To understand seasonal demand, graph a few keywords across a range of countries and consistent periods. Google Trends can be a starting point; don’t compare index data with Google Search Console figures as if they were identical metrics.
Historical notebook: Google Trends analysis with Pytrends. Third-party projects or packages may require adjustments; avoid assuming unofficial endpoints will always be stable.
8. Third case study: AI content impact evaluation
The author also used the ChatGPT experiment as a case study for traffic and engagement analysis. This is where it’s important to distinguish observational from causal experiments. Changes in results can be influenced by algorithm updates, seasonality, publication frequency, content selection, and data quality.
9. Data analyst portfolios sought by business teams
Create three simple projects: a sales or leads dashboard, an SQL for anonymous transactions, and a digital campaign evaluation. Each project should include a business question, data sources, methods, error checking, insights, and recommendations. Choose appropriate metrics: for SEO, this could be related to technical SEO and website traffic. For landing pages, this could be related to buying intent keyword.
Present results without revealing personal information; use licensed public data or training datasets. Code documentation, formula explanations, and dataset versions are more useful than a cluttered dashboard.
10. A realistic 12-week learning plan
| Week | Focus | Deliverable |
|---|---|---|
| 1–2 | Spreadsheets and data quality | Accurate summary reports |
| 3–4 | Applied statistics | Distribution and trend analysis |
| 5–7 | SQL and JOIN | Multi-table datasets |
| 8–10 | Power BI/Looker Studio | KPI Dashboard |
| 11–12 | Final project and presentation | Portfolio with recommendations |
This duration is an example for part-time learning, not a guarantee of being ready to work in three months. Learning speed varies depending on background and quality of training.
Archive of three images from the author’s learning journey
Jupyter screenshots, analysis reports, and initial illustrations are retained as documentation of the project during the previous article. The images do not represent the company’s dashboard or current certification results.
See three original illustrations and screenshots


FAQ about learning to become a beginner data analyst
1. What is a data analyst?
A professional who prepares, analyzes, and explains data for decisions.
2. Do data analysts need to know Python?
Not always; spreadsheets, SQL, statistics, and BI are often required first.
3. What are the most important foundational skills?
Data quality, spreadsheets, SQL, statistics, visualization, and communication.
4. Can you learn data analysis without studying IT?
Yes, with practice and a portfolio that demonstrates your skills.
5. Is SQL mandatory?
Very useful because a lot of business data is stored in relational databases.
6. Which is better? Power BI or Tableau?
Choose based on the tools used by your target organization and training opportunities.
7. What is PL-300?
Microsoft certification for Power BI Data Analyst skills.
8. Can SEO data be used for practice?
Yes, with data you have access to, clear metric definitions, and privacy.
9. What are the drawbacks of Ahrefs traffic figures?
They are generally estimates, not actual website traffic.
10. How long does it take to learn from scratch?
It depends on your background, time, and practice; there is no universal timeframe.
11. What is an example of a first portfolio?
A simple KPI dashboard with sources, methods, and recommendations.
12. Is AI replacing data analysts?
AI helps with certain jobs, but validation, business framing, and decision-making are still important.
External references
- Microsoft — PL-300 study guide 2026
- pandas — official documentation
- Jupyter — documentation and project
- Microsoft — Power BI
- Google — Search Console
